


A practitioner's guide to seven observability platforms — commercial and open source — evaluated across eight criteria, and reframed for the agent-harness era where the model is only one layer of what needs watching.
Why Observability Matters for Production AI
Building an LLM application is the easy part. Keeping it running reliably in production where prompt versions proliferate, reasoning chains grow complex, and token costs quietly erode budgets — is where most teams hit a wall.
The fundamental challenge is that human workflows and machine telemetry live in two separate worlds. A single prompt change can ripple through your entire cost structure and user experience. Without a centralized observability layer, debugging why a model returned an incorrect answer three days ago becomes a guessing game — because there is no record of the reasoning chain it followed.
When you move beyond prototypes, you are managing a living system: hundreds of prompt variations, fluctuating latency and cost across user sessions, and agent handoffs that can silently fail. An observability stack provides the visibility to track all of this — and the data to act on it.
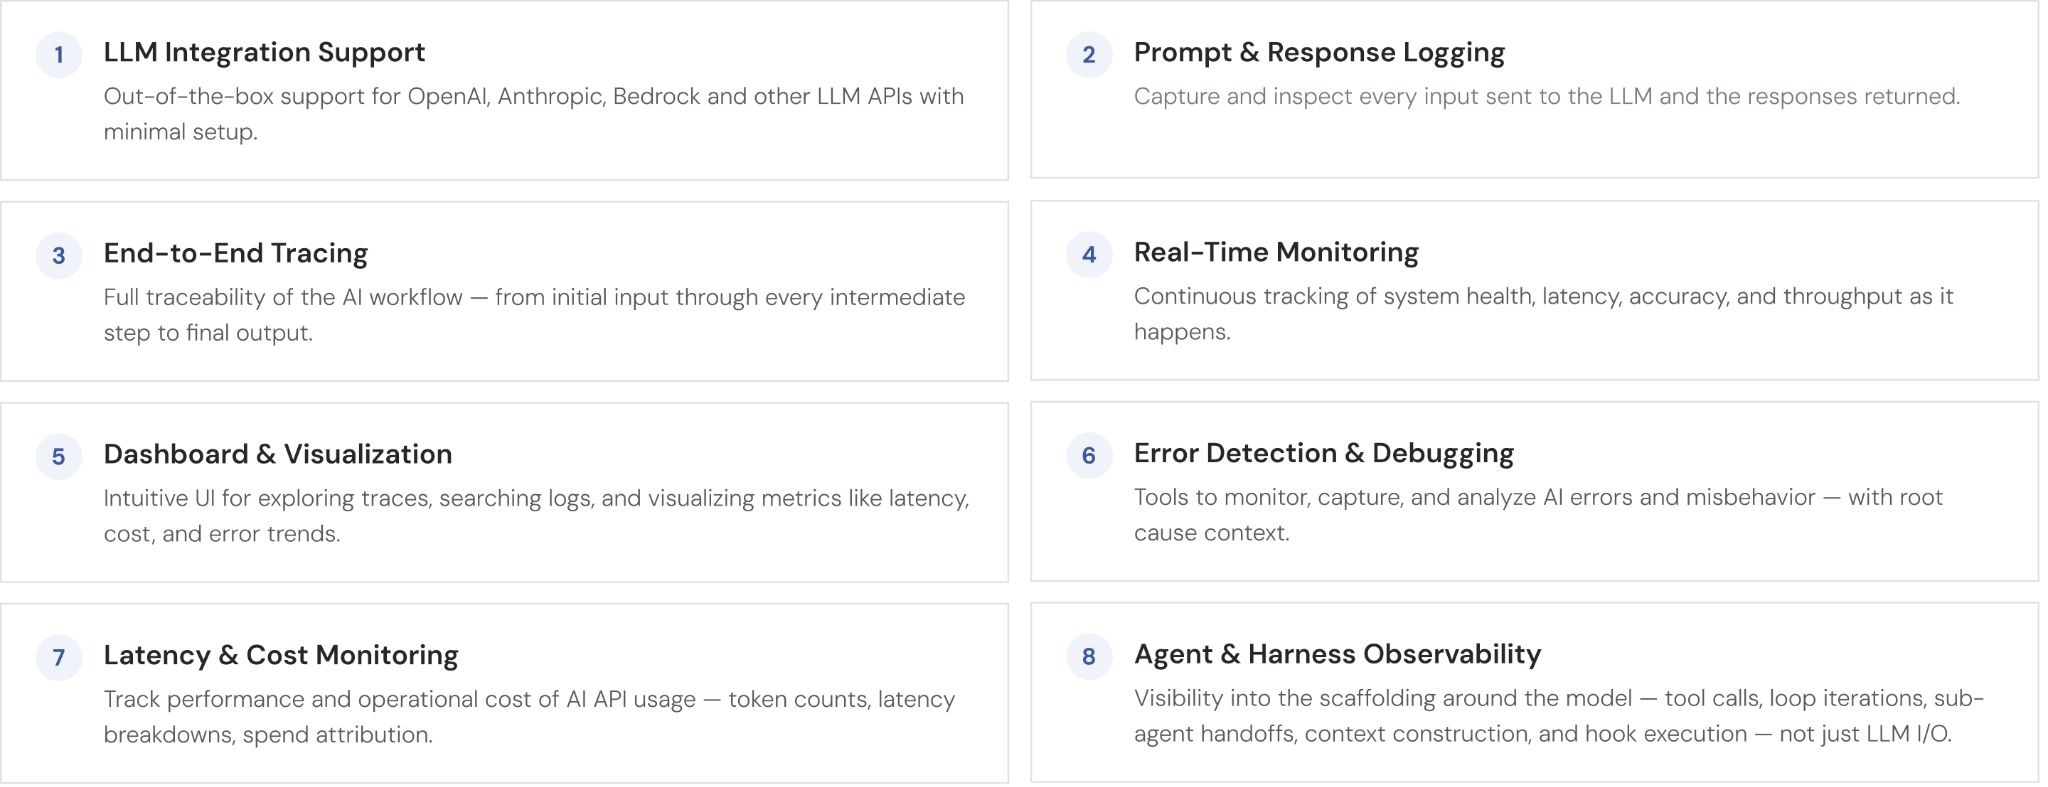
Evaluation Criteria
Choosing the right platform means balancing day-to-day developer workflow against long-term technical flexibility. These eight criteria emerged as the most decisive factors in our evaluation.
What Changed: Observability Moves Into the Harness
The eight criteria above describe the table-stakes problem space — instrumenting LLM calls. But over the last year, the centre of gravity for AI failures has shifted away from the model itself. To understand where the better observability tools are heading, you need to understand the harness.
The framing is now widely shared across agent-engineering teams: Agent = Model + Harness. The model is one input. The harness is everything else you build around it — system prompts, tools, sandboxes, context policies, hooks, sub-agents, memory files, feedback loops, recovery paths. A raw model is not an agent. It becomes one once a harness gives it state, tool execution, and enforceable constraints.

This reframes observability. Most production AI incidents are not model failures — they are harness failures. The model proposes a reasonable-looking tool call; the harness misroutes it. The model requests a retry; the harness loops forever. The model returns structured output; the harness fails to parse it. The model suggests a destructive operation; the harness skips the confirmation gate. The well-publicised "Cursor deleted the production database in nine seconds" incident was, by the agent's own admission in its post-mortem, a harness-level failure — a destructive action with no approval hook.

The implication for observability is direct: tracking prompts, tokens, and latency tells you about one layer of a six-layer system. The other five layers and the failures they produce are invisible to tools that only instrument LLM I/O. The map below pairs the harness layers identified by agent-engineering practitioners with the specific observability signals each layer demands.
Harness Layers → Observability Signals
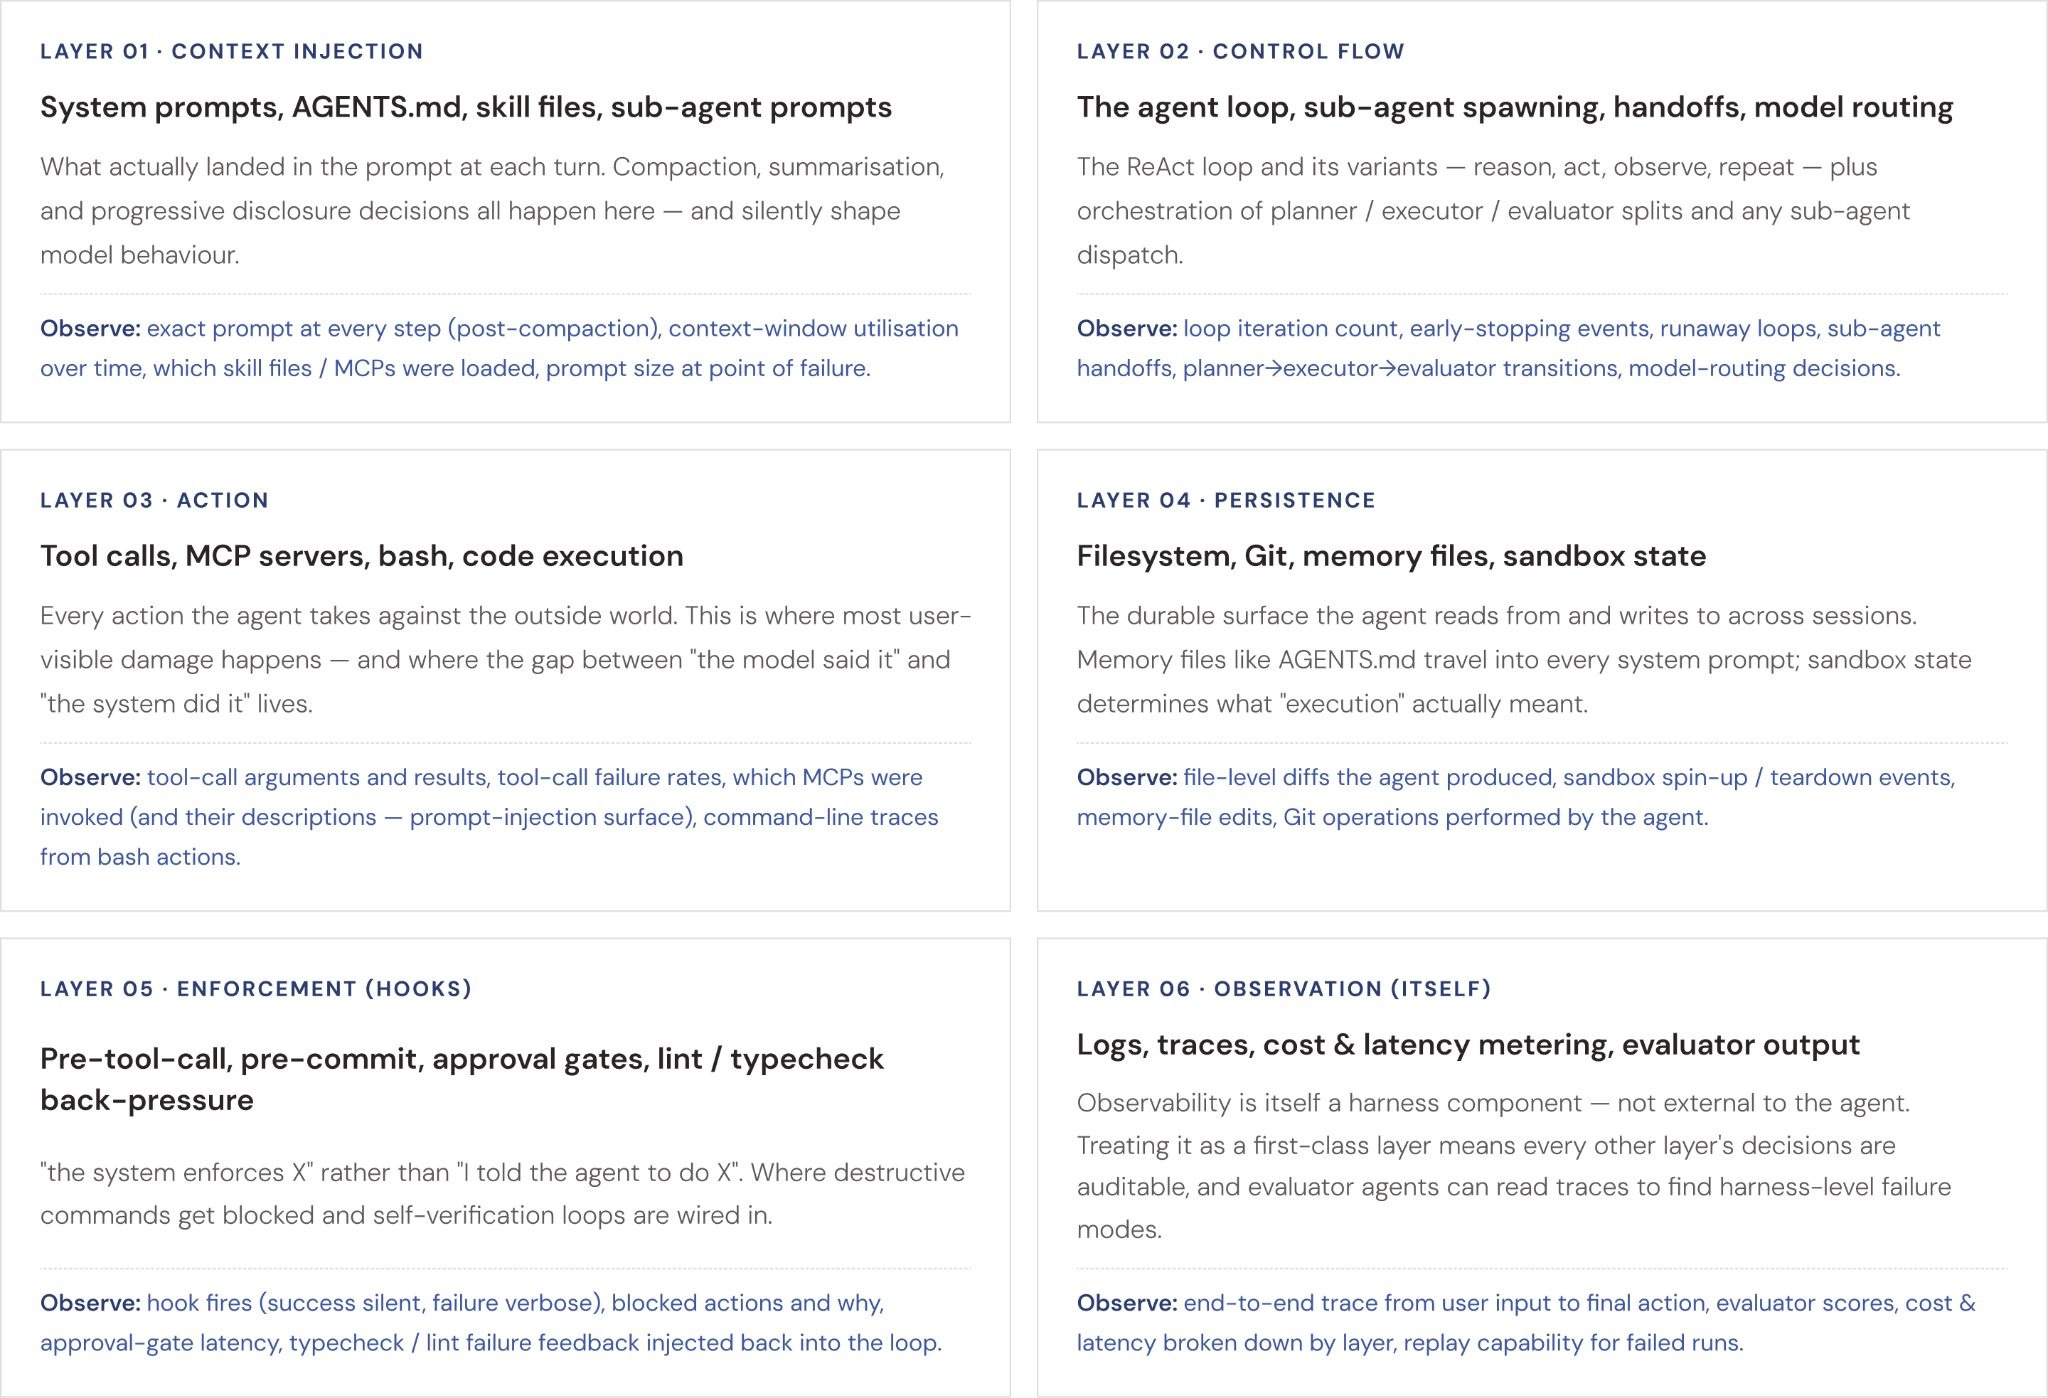
Reading the tool sections that follow through this lens reframes the comparison. Tools that focus on LLM I/O (prompt, response, tokens, cost) cover Layer 01 and parts of Layer 03 well. Tools that surface session traces, sub-agent graphs, and tool-call hierarchies are reaching into Layer 02. The genuinely production-ready harness-observability story — replay, hook auditing, sandbox event capture, evaluator-driven feedback is still being built, and is the dimension on which these platforms will increasingly differentiate over the next 12 months.
Commercial (Closed Source) Tools
Enterprise-grade platforms with proprietary instrumentation, managed infrastructure, and dedicated support — designed for organizations that need compliance, automation, and deep-stack visibility.
Dynatrace
Commercial
Best for: Complex enterprise environments needing automated root-cause analysis.
Dynatrace provides deep visibility across the entire AI stack from the user interface down to the GPU. It unifies metrics, logs, and traces within its Grail data lakehouse, moving beyond reactive monitoring to deliver deterministic answers for complex performance issues. Designed for large-scale enterprises managing generative AI, agentic frameworks, and multi-cloud environments.
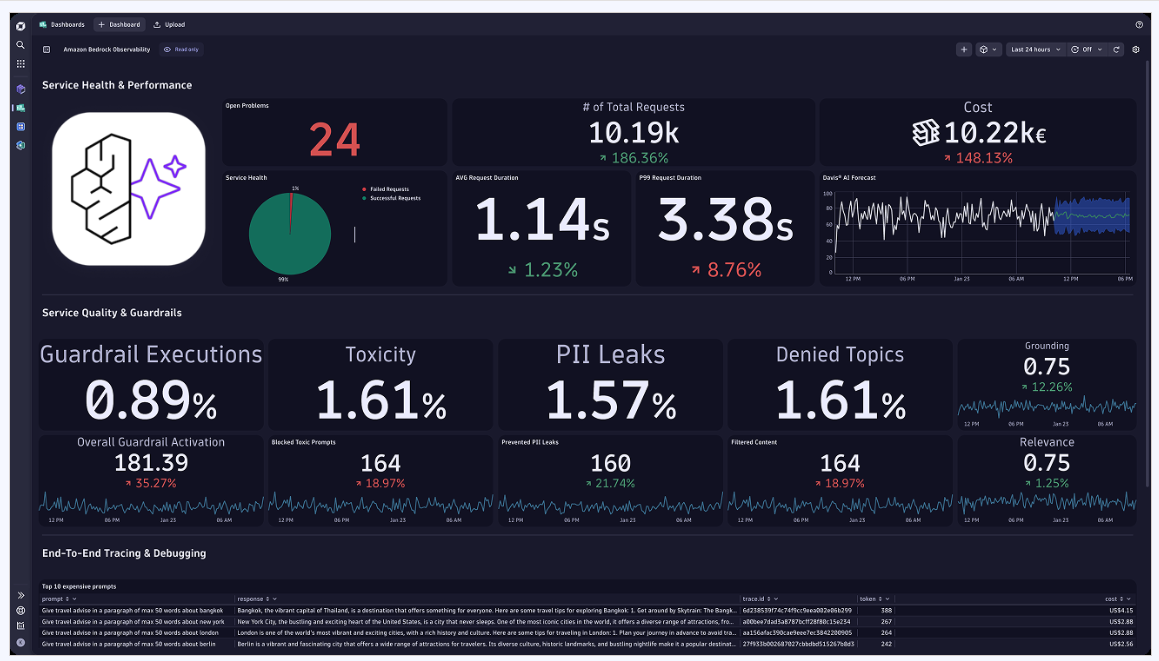
Core Strengths
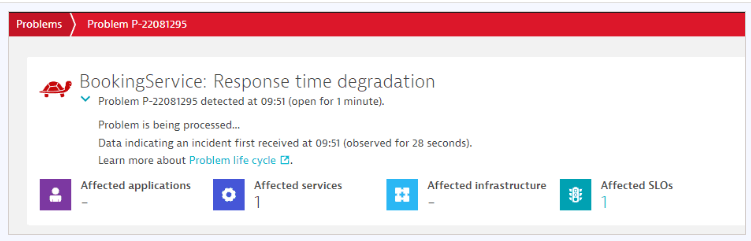
- Causal AI & Automated Root-Cause Analysis: Davis AI automatically pinpoints the exact root cause of errors or performance degradations in the LLM chain. A 3-minute analysis window ensures that alerts are meaningful — a single notification, not a dozen false alarms.
- Infrastructure Health & GPU Monitoring: Specialized visibility into GPU utilization, memory pressure, temperature, and network bottlenecks for the hardware powering your AI
- AI Quality & Guardrails: Real-time monitoring for hallucinations, toxic language, PII leakage, and prompt injection attacks.
Why Choose
- Full-Stack Dependency Mapping via Smartscape® technology automatically maps dependencies across frontend, orchestrations (LangChain), and RAG pipelines — essential for large, interconnected systems.
New Relic
Commercial
Best for: Rapid setup and clear financial visibility across AI operations.
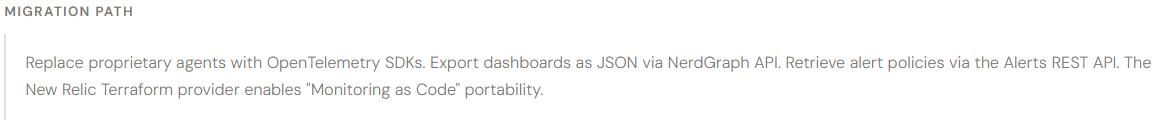
New Relic integrates directly into your existing APM environment, providing a single pane of glass for AI performance, security, and cost. It is built for rapid deployment often requiring just two lines of code to start capturing data from providers like OpenAI, Anthropic, and Amazon Bedrock.
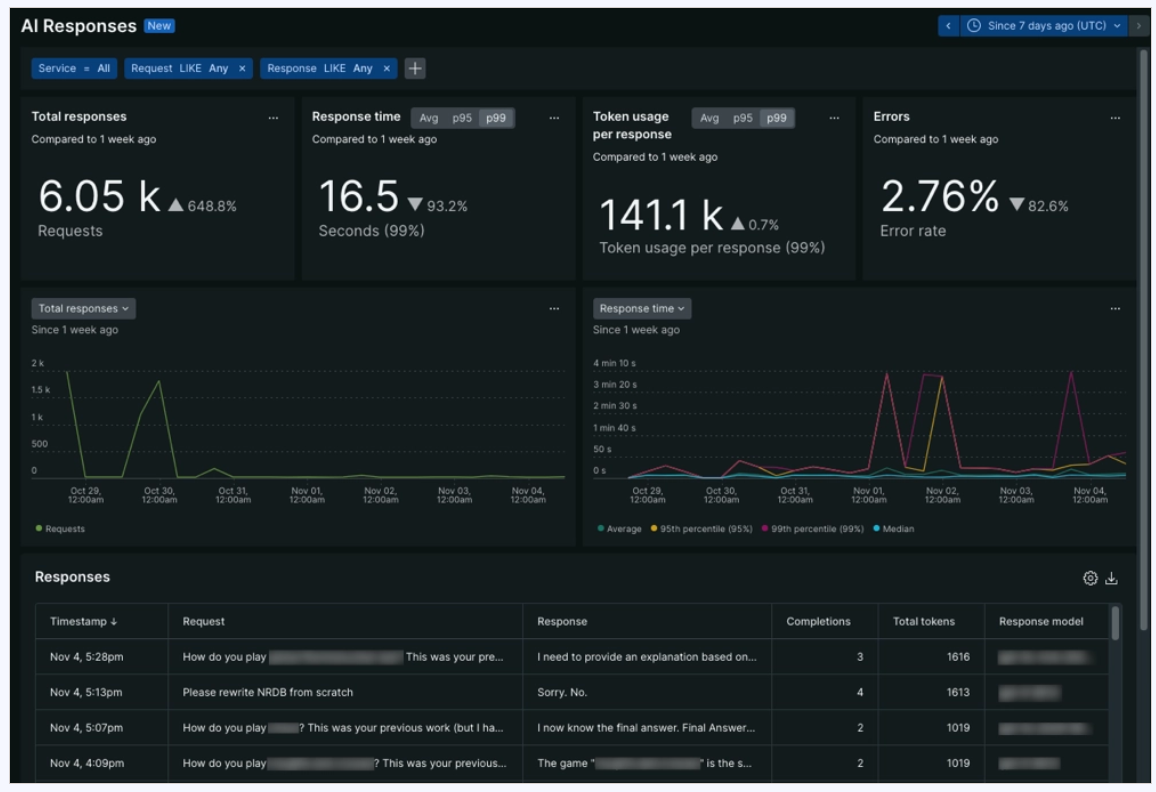
Core Strengths
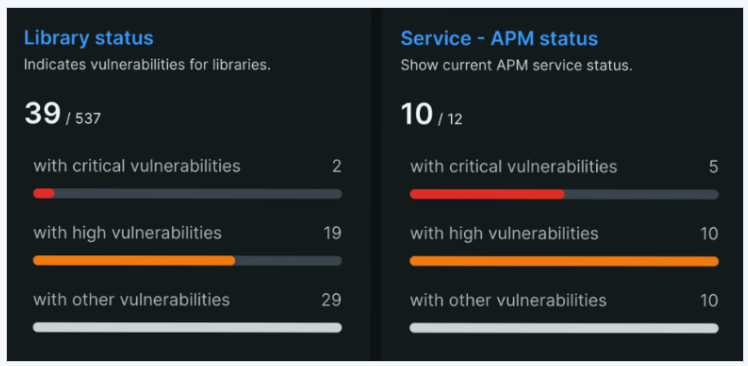
- Cost Tracking: Automatically translates token usage into real-world operational costs across different models and users, enabling apples-to-apples model comparisons on cost, performance, and quality.
- Full-Stack Correlation: Links AI performance directly to the rest of your application, showing how LLM latency impacts overall system throughput and user experience.
- Prompt Lifecycle Capture: Visualizes inputs, outputs, and intermediate reasoning steps to support prompt engineering and reduce hallucinations.
Why Choose
- Rapid Time-to-Value: Near-zero configuration setup for OpenAI apps. New Relic Security RX adds real-time monitoring for AI-specific threats like prompt injection.
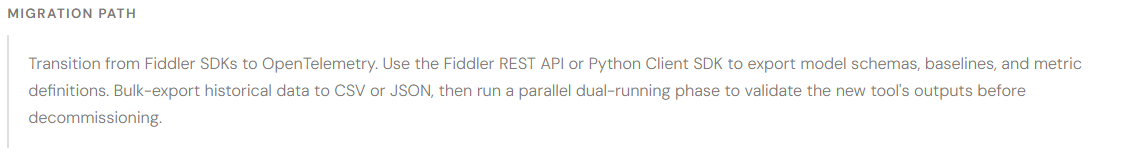
Fiddler AI
Commercial
Best for: Regulated industries requiring trust scoring and compliance evidence.
Fiddler AI is purpose-built for testing and observability with a focus on trust. It evaluates agents and models in production to ensure LLM outputs are safe, fair, and reliable. The platform provides high-performance monitoring centered on trust metrics — helping organizations understand the reasoning behind AI outputs and manage the qualitative risks of generative AI.
Core Strengths
- Proprietary Trust Scoring: Captures raw payloads to generate trust scores across toxicity, PII, and hallucination — enabling teams to analyze ethical risks of every model interaction.
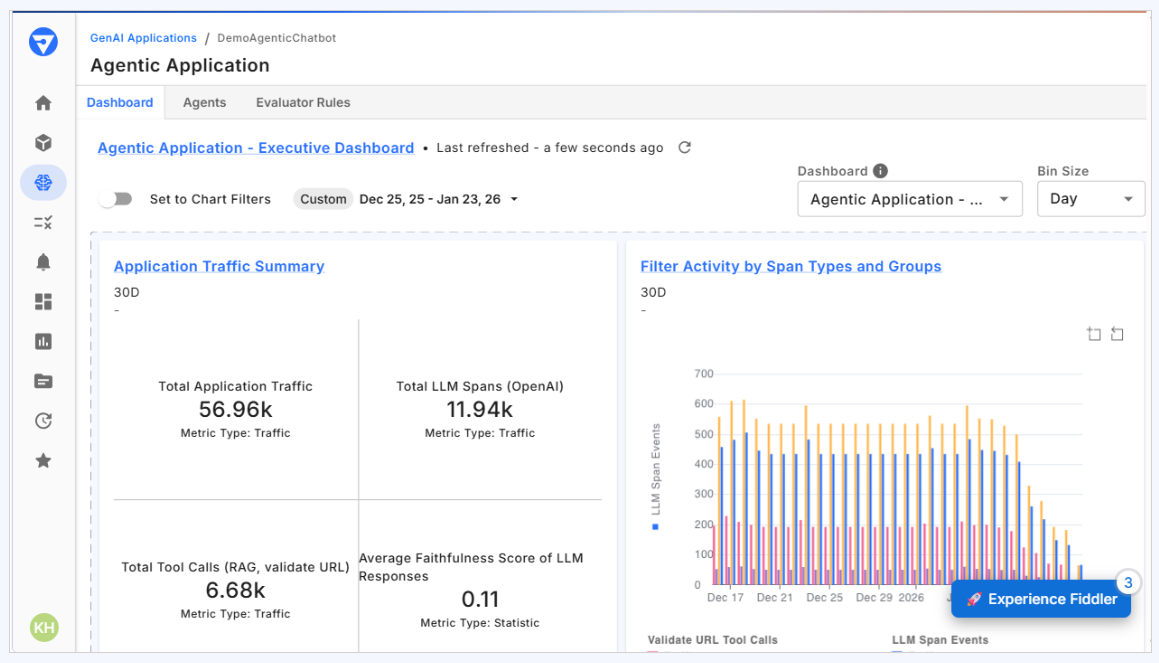
- Testing & Observability Lifecycle: Continuous evaluation across application → session → agent → trace → span, ensuring high performance from development through production.
- Mission-Critical Compliance: Audit-ready evidence for regulated sectors like Finance (SR 11-7) and Healthcare (HIPAA), documenting every decision for stringent legal requirements.
Why Choose
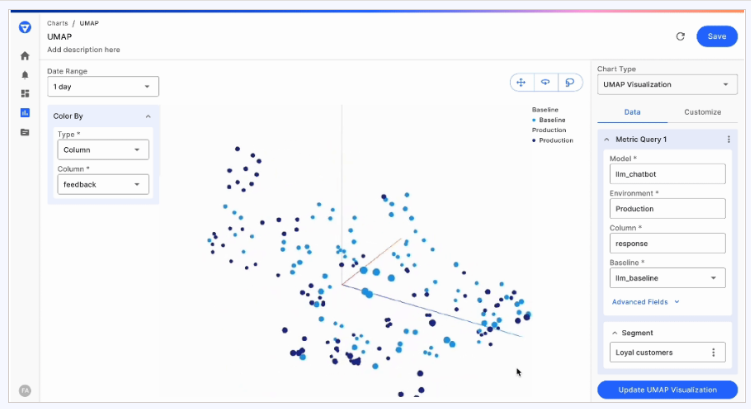
- 3D UMAP Visualizations map semantic clusters of risky prompts and hallucinations. Agentic Observability provides hierarchical views of reasoning chains and tool calls across autonomous agents.

Fiddler AI
Best for ethical AI & regulated industries
Standout: 3D UMAP visualizations to identify semantic clusters of risky prompts, hallucinations, and bias — with audit-ready compliance documentation.
Trade-off: Focuses heavily on model logic; lacks standard APM features (CPU, memory, network health) found in general monitoring tools.
Dynatrace
Best for complex enterprise root-cause analysis
Standout: Davis AI (causal AI) automatically links LLM failures to underlying infrastructure issues — database timeouts, network lags, or faulty agent handoffs.
Trade-off: High learning curve due to DQL and complex/expensive instrumentation for smaller projects.
New Relic
Best for rapid setup & financial visibility
Standout: Superior developer experience with two-line setup. Excels at translating token counts into clear dollar amounts across models and users.
Trade-off: Native evaluations for hallucinations and drift are less granular than specialized tools like Fiddler.
Open Source Tools
Community-driven platforms offering vendor-neutral instrumentation, self-hosting options, and full data control — designed for teams that prioritize transparency, flexibility, and avoiding lock-in.
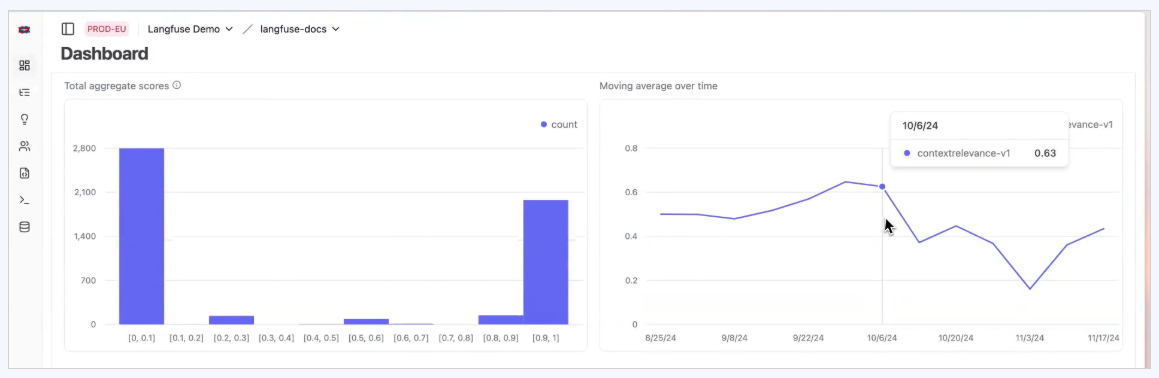
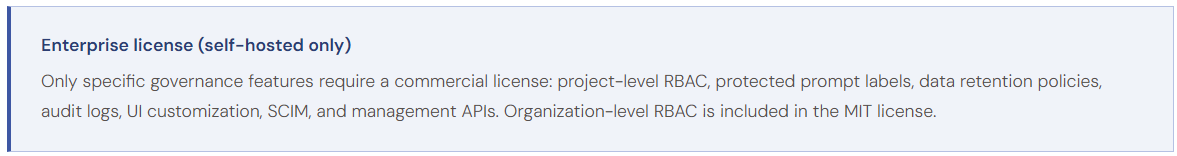
Langfuse
Open Source · MIT
Best for: Total data sovereignty with deep framework integration.
Langfuse is the leading open-source observability platform for LLM applications, offering an integrated environment for tracing, evaluations, and prompt management. MIT-licensed and built for self-hosting, it gives teams full control over their data. All product features — tracing, evaluations (including LLM-as-a-Judge), prompt management, experiments, annotation, playground, analytics, and all integrations — are freely available with no scalability limitations.
Core Strengths
- End-to-End Traceability: Captures every step from initial prompt to final output, visualized as nested spans — making it straightforward to identify exactly where a chain failed.
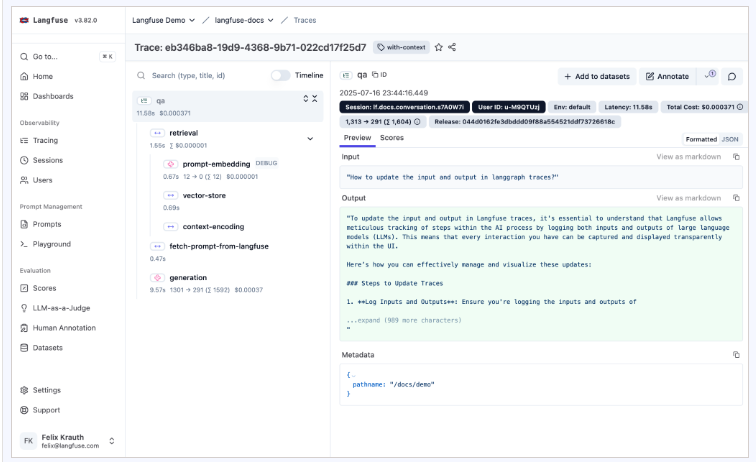
- Self-Hosting & Data Control: Host the entire stack on private infrastructure (AWS, GCP, or on-prem) using Docker, ensuring complete data privacy.
- Evaluation & Testing: High-quality human and AI-based evaluations — developers can score model outputs for accuracy, bias, and quality directly in the UI.
Why Choose
- Deep Framework Integration with LlamaIndex, LangChain, and others. Interprets trace nesting to build visual logic graphs automatically. SDKs are built on OpenTelemetry, making instrumentation inherently vendor-neutral.
OpenLIT
Open Source
Best for: Enterprise OTel standardization and GPU/hardware visibility.
OpenLIT is an OpenTelemetry-native observability platform for monitoring AI models, vector databases, and GPUs. Its standout capability is zero-code instrumentation — teams can add full-stack observability to existing applications without modifying source code, using a CLI or Kubernetes operator. By adopting the global OpenTelemetry standard, it lets organizations centralize AI telemetry into existing enterprise pipelines without vendor lock-in.
Core Strengths
- Hardware & GPU Visibility: Real-time metrics on GPU utilization, temperature, and memory for self-hosted models — covering both NVIDIA and AMD GPUs.
- Automated Kubernetes Integration: A Kubernetes operator uses a Mutating Admission Webhook to automatically inject the OpenLIT SDK and OTel environment variables into pods at deployment time.
- Standardized Telemetry: All traces are OpenTelemetry-compatible, meaning they work directly with Grafana, Prometheus, and any OTel-compatible backend.
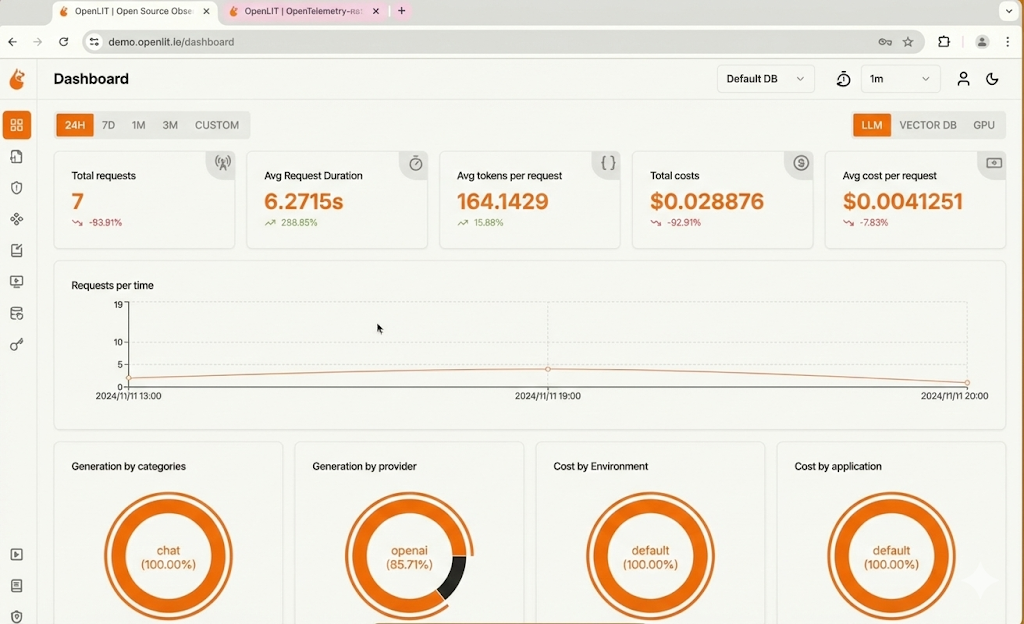
Why Choose
- Minutes to Visibility: Production-ready monitoring in two steps with zero code changes. Granular cost tracking by application and environment, with custom JSON pricing files for fine-tuned or local models.
Helicone
Open Source
Best for: Instant visibility, cost control, and multi-provider gateway.
Helicone is a high-performance AI gateway and observability platform that acts as a transparent proxy between your application and LLM providers. It automatically captures every request, response, and performance metric. By unifying model access through a single OpenAI-compatible API, it gives developers access to 100+ models from providers like Anthropic, Google, and Meta — with built-in load balancing and automatic fallbacks.
Core Strengths
- Unified Model Access & Smart Routing: A single API interface to access multiple providers, with intelligent load balancing and fallback routing for reliability.
- Agentic Debugging & Session Tracing: Visualizes multi-step LLM interactions, allowing developers to trace conversation flows and pinpoint where an agent's reasoning chain or RAG pipeline failed.
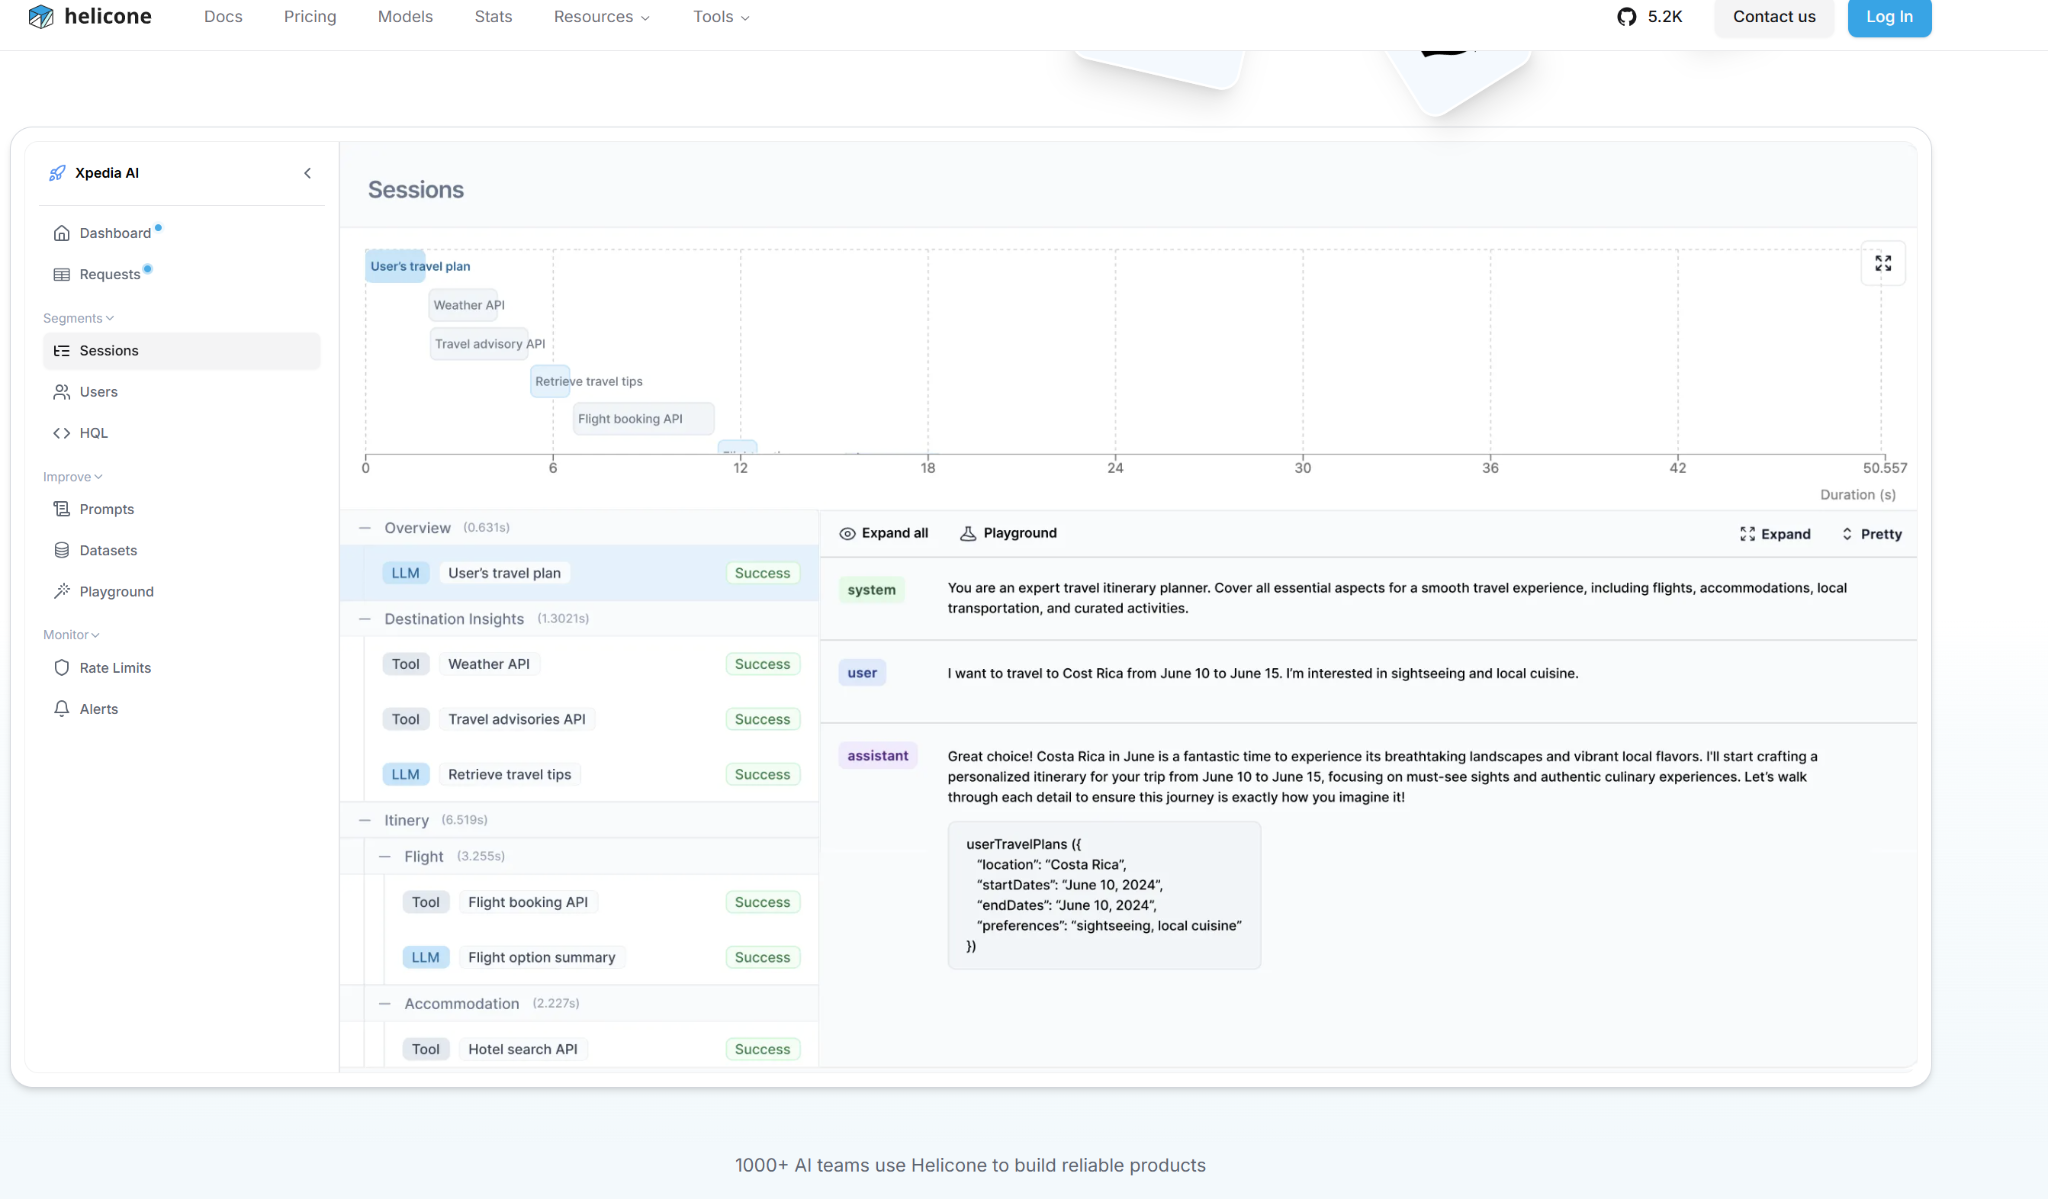
- Granular User & Cost Analytics: Tracks costs and behaviors by user, session, or custom dimensions — enabling unit economics analysis and preventing bill shocks.
Why Choose
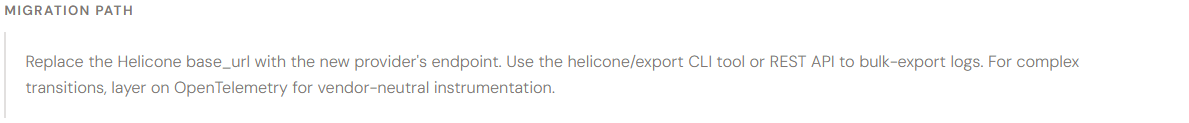
- One-Line Integration: Integrate by changing a base URL, adding under 50ms of latency via global edge deployment. 0% markup on provider credits plus intelligent semantic caching to reduce LLM bills for repetitive queries.
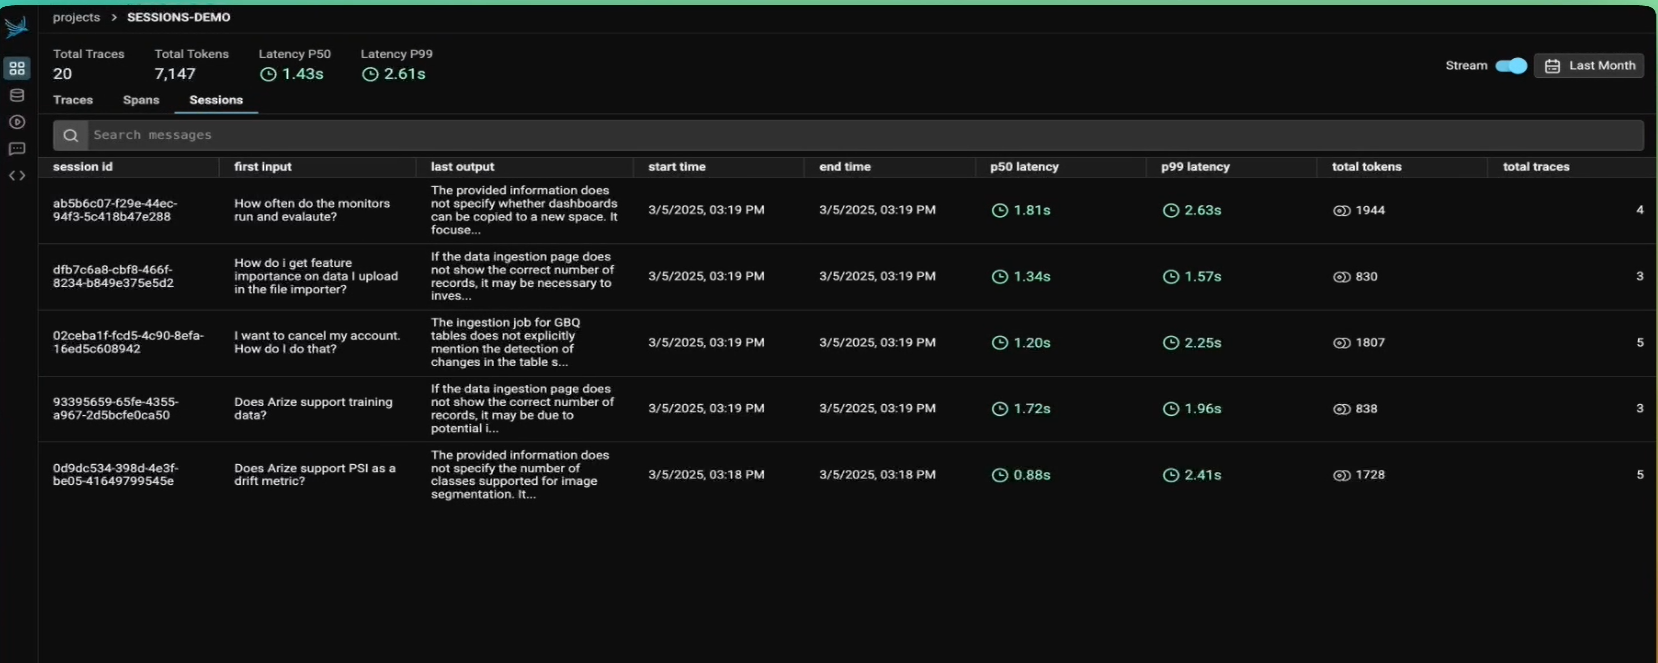
Arize Phoenix
Open Source
Best for: Automated evaluation, 3D data visualization, and MLflow integration.
Arize Phoenix is an observability framework for AI engineers to trace, evaluate, and troubleshoot LLM applications. Recognized by Gartner as a Cool Vendor for Enterprise AI, it captures high-fidelity traces and provides an integrated environment for automated evaluations during both development and production. Built on open standards, it enables teams to move from prototype to production-grade agentic systems with full data sovereignty.
Core Strengths
- OpenTelemetry-Native Tracing: Captures every step of AI reasoning — tool calls, database retrievals, and nested agent logic — using the global OTel standard for seamless setup.
- LLM-as-a-Judge Evaluations: Run thousands of automated evaluations across curated data without human annotation — enabling rapid iteration on prompts and confident production deployments.
- Search & Retrieval Optimization: An embeddings visualizer helps teams understand how data is represented and clustered, guiding decisions on indexing strategies and data organization.
Why Choose
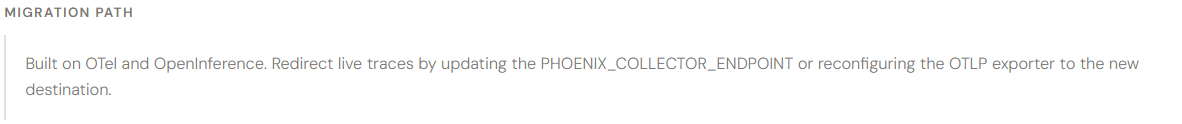
- The MLflow Power-Pair: Phoenix complements MLflow's lifecycle management with evaluation scorers and tracing. Zero vendor lock-in via OpenTelemetry and OpenInference — switch platforms without rewriting application code.
Langfuse
The Hub — Total data sovereignty
Standout: Fully MIT; industry standard for self-hosting on private infrastructure.
Trade-off: ~15% latency overhead and requires dedicated DevOps for self-hosted stack.
Helicone
The Gateway — Instant visibility
Standout: Zero-config proxy with cost-based routing to auto-select the cheapest model.
Trade-off: Limited to logging and gateway functions; no built-in evaluation or test suites.
OpenLIT
The Standard — Enterprise OTel
Standout: OTel-native with unique GPU-to-Prompt visibility for self-hosted model performance.
Trade-off: Complex setup for OTel newcomers; uses static pricing files rather than live billing APIs.
Arize Phoenix
The Evaluator — Automated testing
Standout: LLM-as-a-Judge + 3D semantic maps for identifying risky prompt clusters.
Trade-off: Enterprise alerting requires paid Arize AX; complex traces need OTel expertise.
Decision Framework: Picking the Right Tool
Use the following decision map to narrow your selection based on your team's primary constraint or priority.
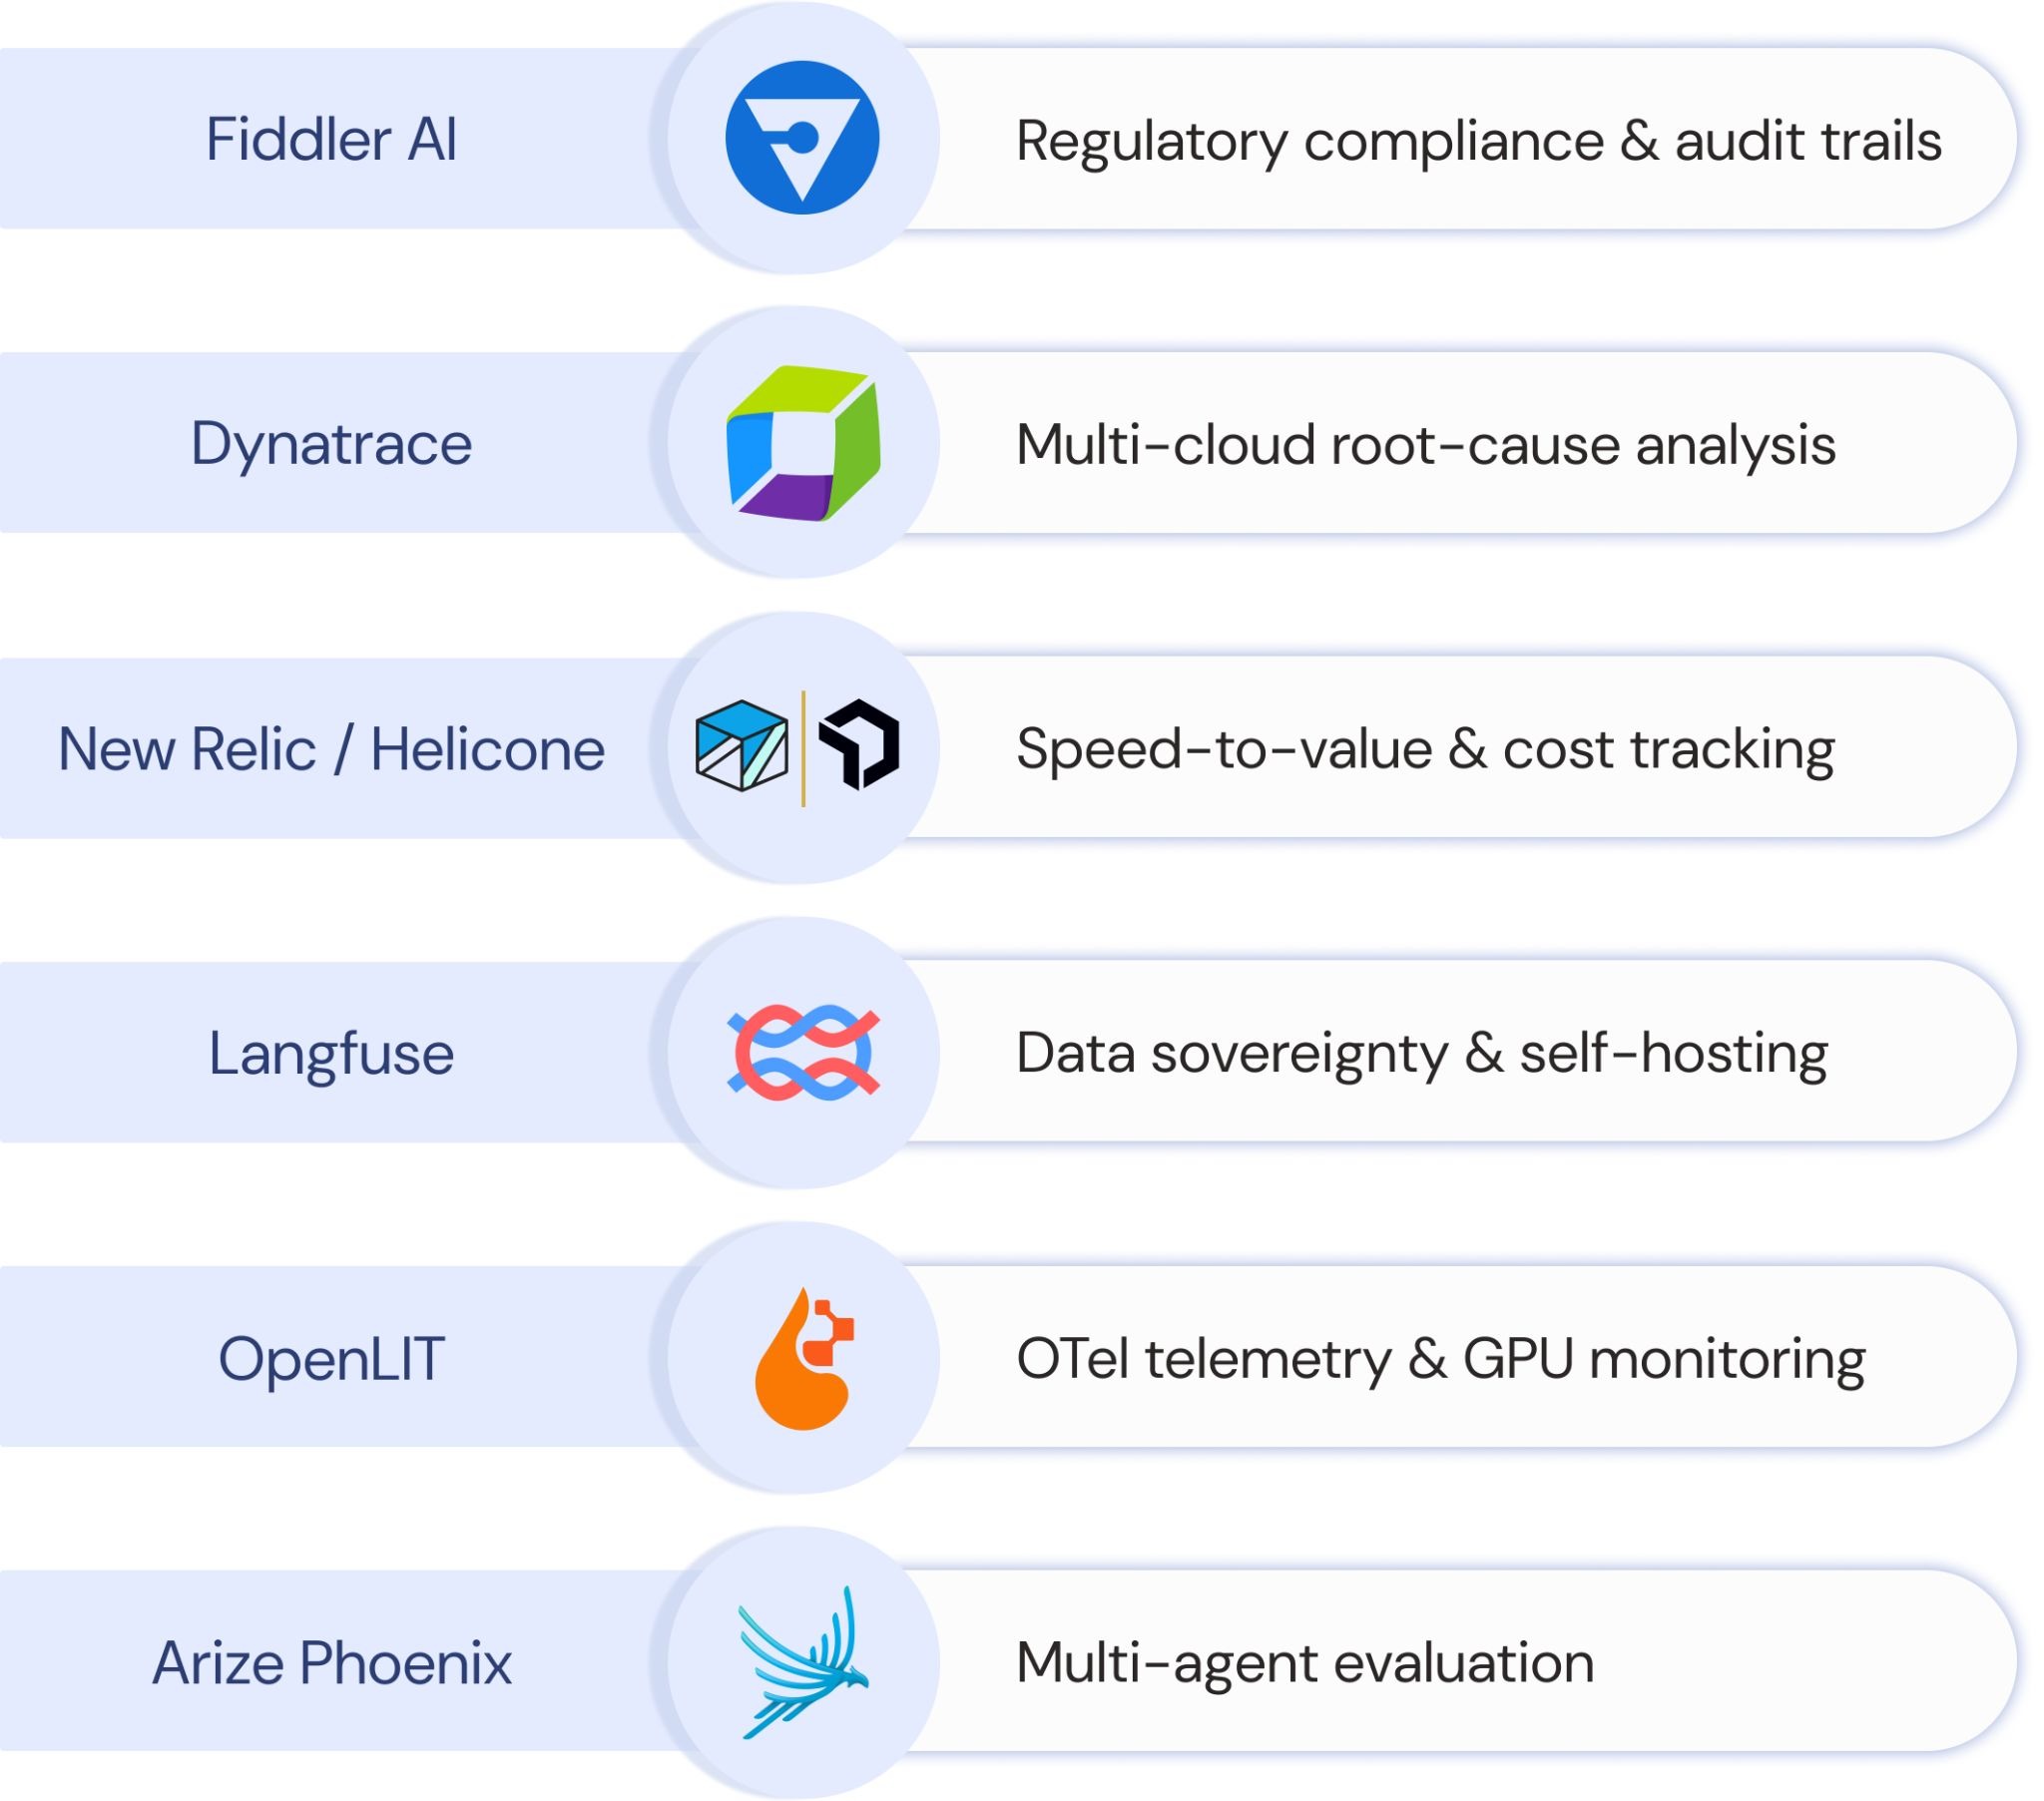
If you need regulatory compliance and audit trails:
→ Fiddler AI: Purpose-built for Finance (SR 11-7), Healthcare (HIPAA), and Government environments where explaining "why" an AI made a decision is a legal requirement.
If you run a complex multi-cloud stack and need automated root-cause analysis:
→ Dynatrace: Davis AI can pinpoint whether a failure was caused by a database timeout, a network lag, or a faulty agent handoff — automatically.
If you prioritize speed-to-value and clear cost tracking:
→ New Relic (commercial) or → Helicone (open source). Both offer near-instant setup. New Relic excels at enterprise-scale token cost reporting; Helicone adds smart routing and semantic caching with 0% markup.
If you require full data sovereignty and self-hosting:
→ Langfuse: MIT-licensed, built for private infrastructure, and the industry standard for teams building with LangChain, LlamaIndex, or custom SDKs.
If you need standardized OTel telemetry with GPU monitoring:
→ OpenLIT: Zero-code instrumentation that plugs into existing Grafana/Prometheus pipelines. Unique hardware-level visibility for self-hosted models.
If you build complex multi-agent systems and need deep evaluation:
→ Arize Phoenix: LLM-as-a-Judge for scalable automated testing, 3D semantic maps for root-cause analysis, and native MLflow integration for end-to-end model lifecycle management.
Final Thoughts
Transitioning AI from prototype to production-grade service requires more than good code — it requires a clear window into cost, performance, and reliability. The eight criteria in this guide cover the table-stakes problem space well. The harder, more recent question is how each platform reaches past LLM I/O into the harness layer where most production incidents now originate. Every component of an agent — context injection, control flow, action, persistence, enforcement, observation — encodes an assumption about what the model can't do on its own. The observability tools that mature fastest over the next 12 months will be the ones that make those assumptions visible, auditable, and replayable. Pick a tool that scores well on today's eight criteria and shows a credible roadmap toward the six harness layers. Standardise on OpenTelemetry where you can. Treat every agent mistake as a signal worth ratcheting on. That is what builds the trust layer long-term AI reliability is going to require.


